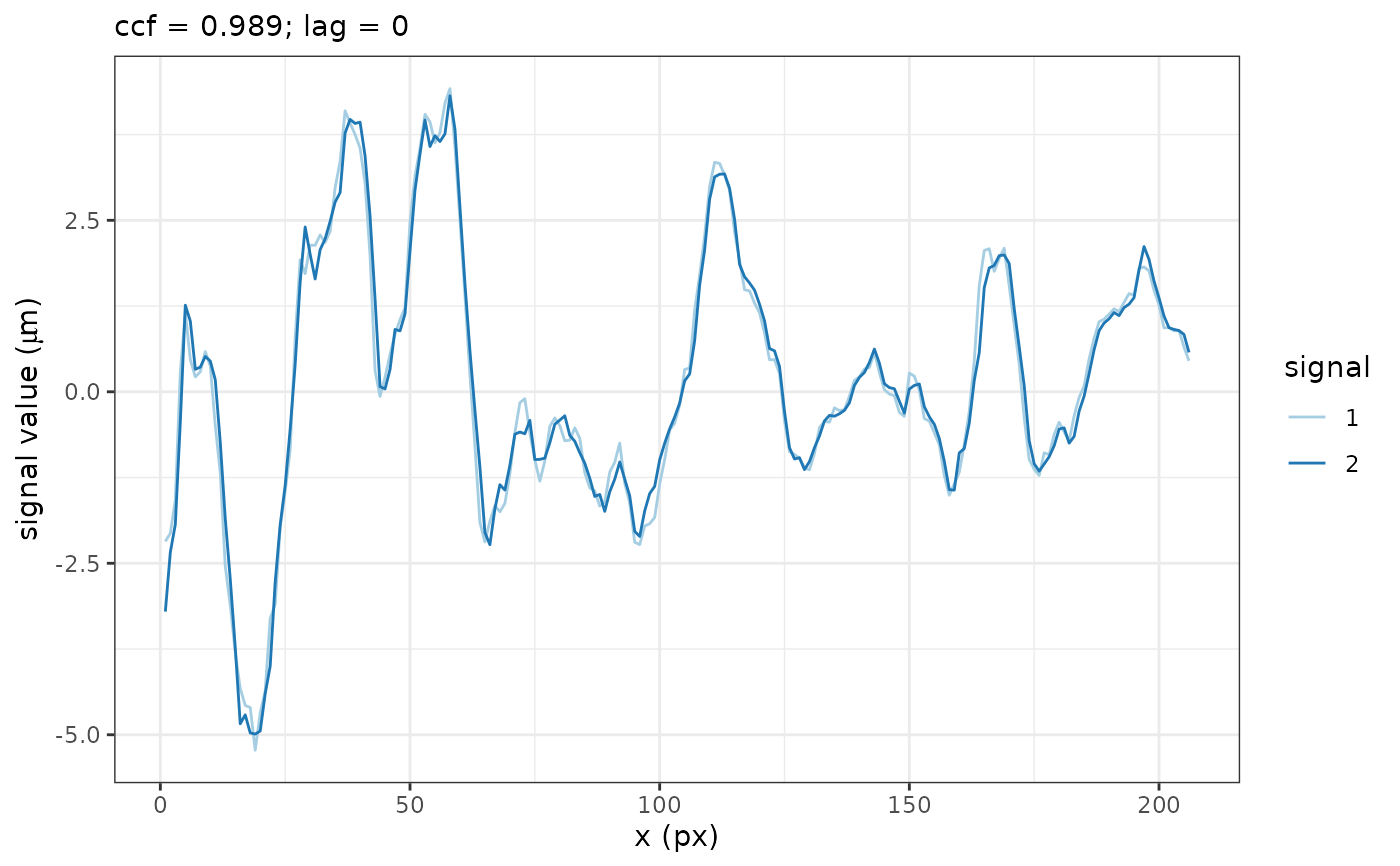
This function aligns two numeric signal vectors. It also provides an option to visualize the aligned signals.
Usage
vec_align_sigs_list(
  sig1,
  sig2,
  min.overlap = NULL,
  ifplot = FALSE,
  legendname = "signal",
  titlename = NULL,
  subtitlename = TRUE
)
Arguments
- sig1
The first numeric signal vector.
- sig2
The second numeric signal vector.
- min.overlap
An optional parameter passed to
bulletxtrctr::get_ccfto specify the minimum overlap between signals.- ifplot
A Boolean flag indicating whether to save ggplot lists in the output attributes.
- legendname
A string to label the legend in the plot.
- titlename
A string to set the title of the plot.
- subtitlename
A string to set the subtitle of the plot. Show
ccfandlagifTRUE.
Value
A list containing the cross-correlation function (ccf), the lag (lag), and the landmarks (lands) of the aligned signals. This follows the output format of bulletxtrctr::sig_align.
Examples
x3p <- x3p_subsamples[[1]]
insidepoly_df <- x3p_insidepoly_df(x3p, mask_col = "#FF0000", concavity = 1.5, b = 1)
x3p_inner_nomiss_res <- df_rmtrend_x3p(insidepoly_df)
x3p_inner_impute <- x3p_impute(x3p_inner_nomiss_res,
  ifout = FALSE, ifsave = FALSE, dir_name = NULL, ifplot = FALSE
)
x3p_bin_rotate <- x3p_vertical(x3p_inner_impute, min_score_cut = 0.1)

aligned <- vec_align_sigs_list(
  x3p_raw_sig_df(x3p_bin_rotate)$sig,
  x3p_shift_sig_df(x3p_bin_rotate)$sig,
  ifplot = TRUE,
  subtitlename = TRUE
)
#> Warning: No enough non-NA MSE values to fit parabola.
#> Warning: No enough non-NA MSE values to fit parabola.
#> Warning: No enough non-NA MSE values to fit parabola.
#> Warning: Minimum value of the parabola is out of preset delta range. Use 0 shifting.
#> Warning: Minimum value of the parabola is out of preset delta range. Use 0 shifting.
#> Warning: Minimum value of the parabola is out of preset delta range. Use 0 shifting.
#> Warning: Minimum value of the parabola is out of preset delta range. Use 0 shifting.
#> Warning: Minimum value of the parabola is out of preset delta range. Use 0 shifting.
#> Warning: Minimum value of the parabola is out of preset delta range. Use 0 shifting.
#> Warning: Minimum value of the parabola is out of preset delta range. Use 0 shifting.
#> Warning: Minimum value of the parabola is out of preset delta range. Use 0 shifting.
#> Warning: Minimum value of the parabola is out of preset delta range. Use 0 shifting.
#> Warning: Minimum value of the parabola is out of preset delta range. Use 0 shifting.
#> Warning: Minimum value of the parabola is out of preset delta range. Use 0 shifting.
#> Warning: Minimum value of the parabola is out of preset delta range. Use 0 shifting.
#> Warning: Minimum value of the parabola is out of preset delta range. Use 0 shifting.
#> Warning: Minimum value of the parabola is out of preset delta range. Use 0 shifting.
#> Warning: Minimum value of the parabola is out of preset delta range. Use 0 shifting.
#> Warning: Minimum value of the parabola is out of preset delta range. Use 0 shifting.
#> Warning: Minimum value of the parabola is out of preset delta range. Use 0 shifting.
#> Warning: Minimum value of the parabola is out of preset delta range. Use 0 shifting.
#> Warning: Minimum value of the parabola is out of preset delta range. Use 0 shifting.
#> Warning: Minimum value of the parabola is out of preset delta range. Use 0 shifting.
#> Warning: Minimum value of the parabola is out of preset delta range. Use 0 shifting.
#> Warning: Minimum value of the parabola is out of preset delta range. Use 0 shifting.
#> Warning: Minimum value of the parabola is out of preset delta range. Use 0 shifting.
#> Warning: Minimum value of the parabola is out of preset delta range. Use 0 shifting.
#> Warning: Minimum value of the parabola is out of preset delta range. Use 0 shifting.
#> Warning: Minimum value of the parabola is out of preset delta range. Use 0 shifting.
#> Warning: Minimum value of the parabola is out of preset delta range. Use 0 shifting.
#> Warning: Minimum value of the parabola is out of preset delta range. Use 0 shifting.
#> Warning: Minimum value of the parabola is out of preset delta range. Use 0 shifting.
#> Warning: Minimum value of the parabola is out of preset delta range. Use 0 shifting.
#> Warning: Minimum value of the parabola is out of preset delta range. Use 0 shifting.
#> Warning: Minimum value of the parabola is out of preset delta range. Use 0 shifting.
#> Warning: Minimum value of the parabola is out of preset delta range. Use 0 shifting.
#> Warning: Minimum value of the parabola is out of preset delta range. Use 0 shifting.
#> Warning: Minimum value of the parabola is out of preset delta range. Use 0 shifting.
#> Warning: Minimum value of the parabola is out of preset delta range. Use 0 shifting.
#> Warning: Minimum value of the parabola is out of preset delta range. Use 0 shifting.
#> Warning: Minimum value of the parabola is out of preset delta range. Use 0 shifting.
#> Warning: Minimum value of the parabola is out of preset delta range. Use 0 shifting.
#> Warning: Minimum value of the parabola is out of preset delta range. Use 0 shifting.
#> Warning: Minimum value of the parabola is out of preset delta range. Use 0 shifting.
#> Warning: Minimum value of the parabola is out of preset delta range. Use 0 shifting.
#> Warning: Minimum value of the parabola is out of preset delta range. Use 0 shifting.
#> Warning: No enough non-NA MSE values to fit parabola.
#> Warning: No enough non-NA MSE values to fit parabola.

attr(aligned, "sig_align_plot")

