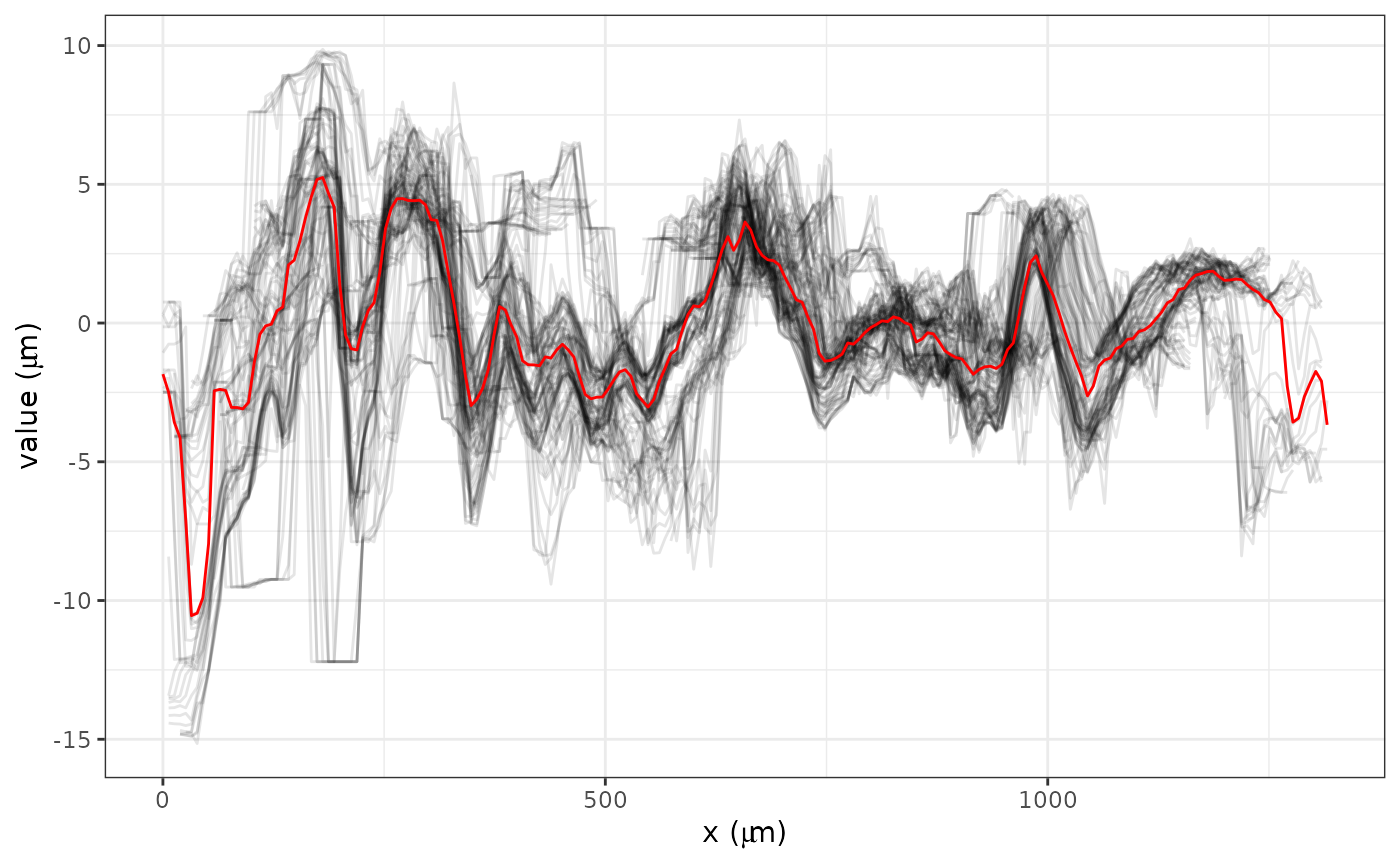
This function extracts the signal from a raw x3p object by computing summary statistics of values along the y axis for each x value.
Arguments
- x3p
An
x3pobject representing a topographic scan.- ifplot
A Boolean flag indicating whether to save ggplot lists in the output attributes.
Examples
x3p <- x3p_subsamples[[2]]
insidepoly_df <- x3p_insidepoly_df(x3p, mask_col = "#FF0000", concavity = 1.5, b = 1)
x3p_inner_nomiss_res <- df_rmtrend_x3p(insidepoly_df)
x3p_inner_impute <- x3p_impute(x3p_inner_nomiss_res,
  ifout = FALSE, ifsave = FALSE, dir_name = NULL, ifplot = FALSE
)
x3p_bin_rotate <- x3p_vertical(x3p_inner_impute, min_score_cut = 0.1, ifplot = FALSE)

raw_sig_df <- x3p_raw_sig_df(x3p_bin_rotate, ifplot = TRUE)

attr(raw_sig_df, "sig_df_plot")
#> Warning: Removed 7442 rows containing missing values or values outside the scale range
#> (`geom_line()`).

